AUC: Area Under the Curve formulas
In Neuroscience it is common to have repeated measurements over time of changes occurring in physiological or endocrinological variables. Here is an example of a repeated measurement of cortisol (using fake data):
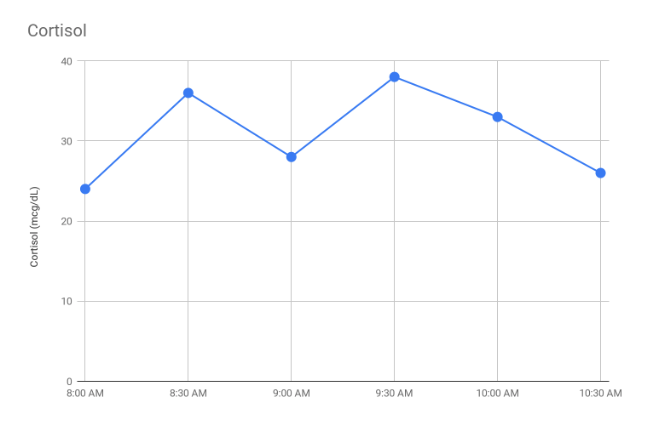
As you can see we have 6 different measurements of cortisol at different times. This could become a problem in statistical analyses since we would have many different values to compare from. That’s why the area under the curve (AUC) is often used for incorporating multiple time points.
As mentioned by Pruessner et al. (2003):
The computation of the AUC allows the researcher to simplify the statistical analysis and increase the power of the testing without sacrificing the information contained in multiple measurements
The point is clear, AUC will help us to simplify our analyses in many cases.
Within AUC we have two different types of formulas which will serve for different purposes:
- AUCg: Area under the curve with respect to ground.
- AUCi: Area under the curve with respect to increase.
AUCg
This formula can be derived from the trapezoid formula. As seen in the following figure a trapezoid is made by triangles and rectangles with the help of time points and values recorded in each time point:
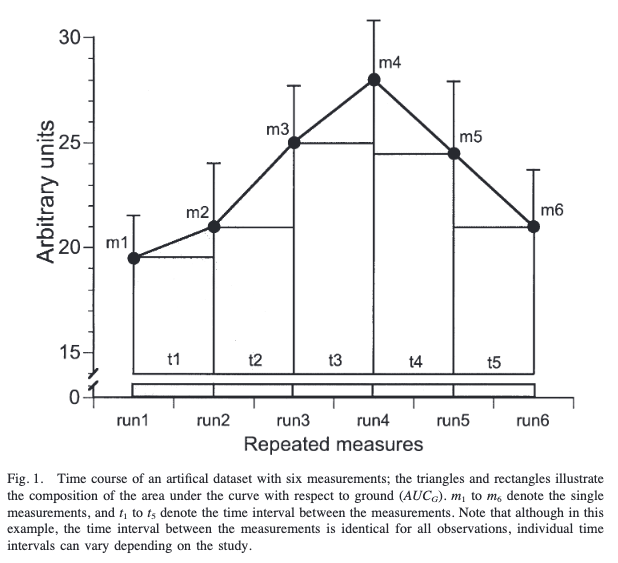
With the help of the figure is easier to understand the data we need to calculate the formula:
- The measurements (m1 - m6)
- The time differences between measurements (t1 - t6)
With the following formula we will be able to calculate the total area under the curve of all the measurements and provide a single data value which will be useful for our analyses (e.g. calculating the overall diurnal cortisol secretion).
Also, this formula can be further simplified in the case that time differences between measurements are identical. Those time differences won’t be included in the formula now:
AUCi
There is another formula for another area of interest showed in the following figure:
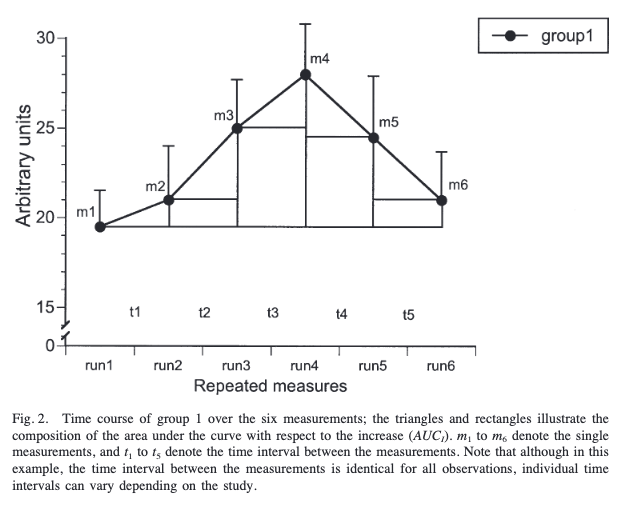
We can see that the reference is the value of the first data point and not zero. Contrary to AUCg this helps highlighting changes over time. That’s why the name of the formula receives the name of Area Under the Curve respect to the Increase.
The formula is similar to the one we saw with AUCg. The difference is that we should remove the area between ground and the first data point:
And as in the other formula we can remove t if the time distance is constant between different measurements:
That’s it! I actually wrote this post for myself, but I hope this can be useful for anyone. Cheers! 🕵️
References
Pruessner, J. C., Kirschbaum, C., Meinlschmid, G., & Hellhammer, D. H. (2003). Two formulas for computation of the area under the curve represent measures of total hormone concentration versus time-dependent change. Psychoneuroendocrinology, 28(7), 916–931. https://doi.org/10.1016/S0306-4530(02)00108-7